Monitoring ranges from an overview of the plant down to the equipment level. The data monitored by the Condition Monitoring system exclusively considers the systems integrated in the Data Platform and prioritized equipment.
The platform and dashboards are highly customizable according to the available data and the needs of the front teams.
For the implementation of the Condition Monitoring system to be possible:
·
Sensor and system data must be connected online.
·
Shape’s integrated data platform needs to be implemented.
You can use all of Shape's knowledge to your advantage:
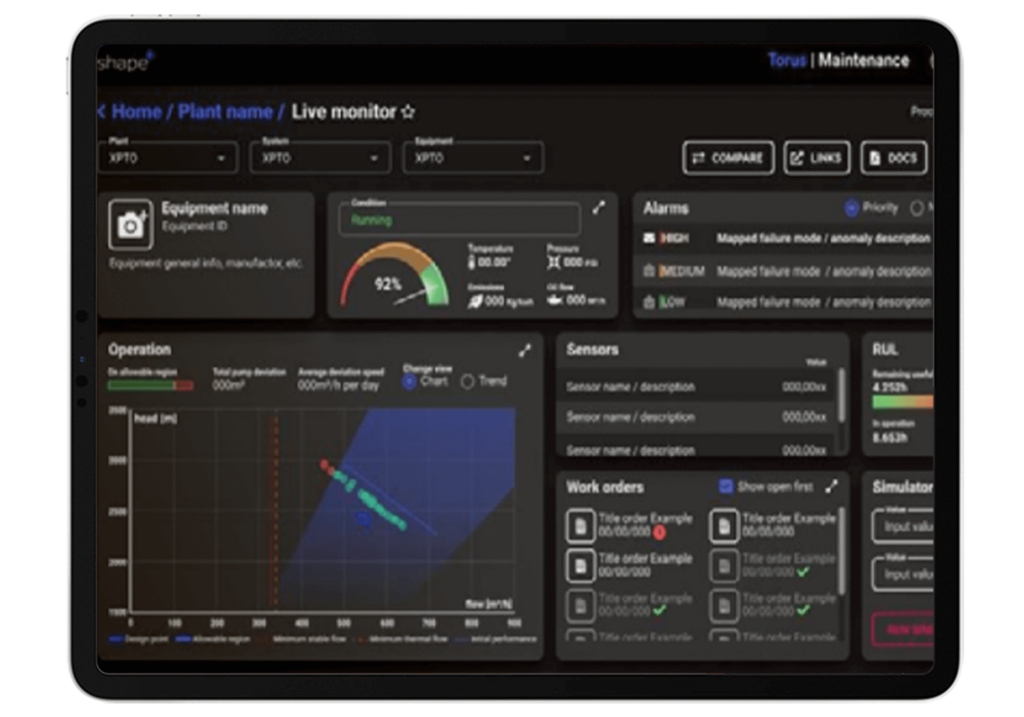
DASHBOARD IN YOUR HANDS
Among the possible integrations of data and visualizations at the device level are:
·
Monitoring of current operating parameters in graph or trend;
·
Visualization of service order history integrated with ERP systems;
·
Viewing the history of alarms generated by the systems predictive maintenance;
·
Links to drawings, process flowcharts, manuals and other documents related to the equipment;
·
List of process equipment and sensors;
·
Estimated useful life of the equipment (depends on integration with predictive maintenance module);
·
Comparative table of the state of the different equipment.
WHERE DOES YOUR CBM OPERATE?
Condition Based Maintenance (CbM) models aim to alert users when assets are operating out of specification. Higher accuracy but lower reaction time like a PdM tool.
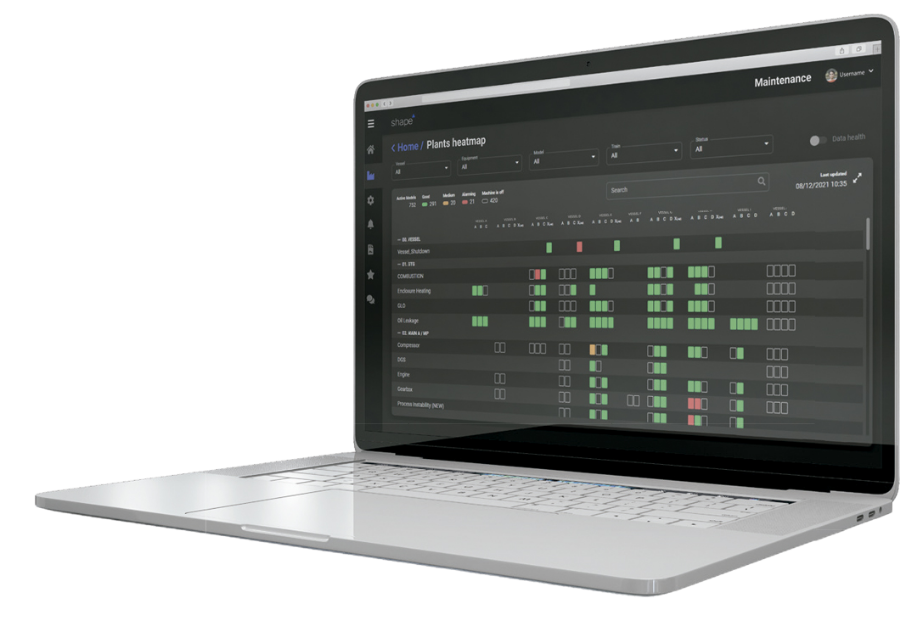
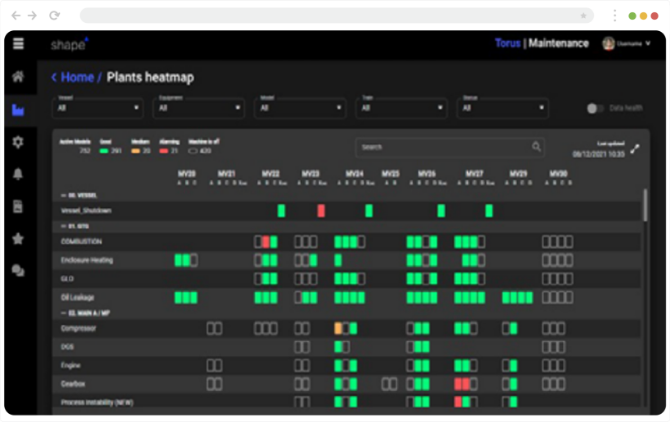
HEAT MAP
The heat map screen gives managers a bird’s-eye view of the current condition of multiple plants, helping them to allocate resources for diagnosis and treatment.
ALARM MANAGER
The alarm manager allows users to quickly identify equipment with a high-risk failure mode and take action to prevent it. Notifications are sent to stakeholders to ensure timely action.
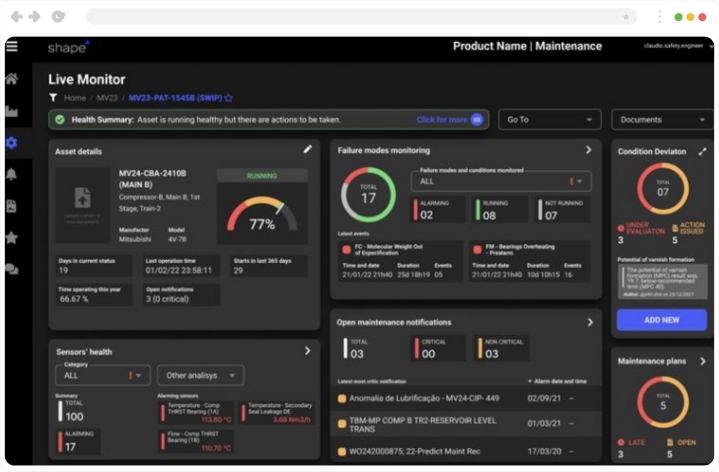
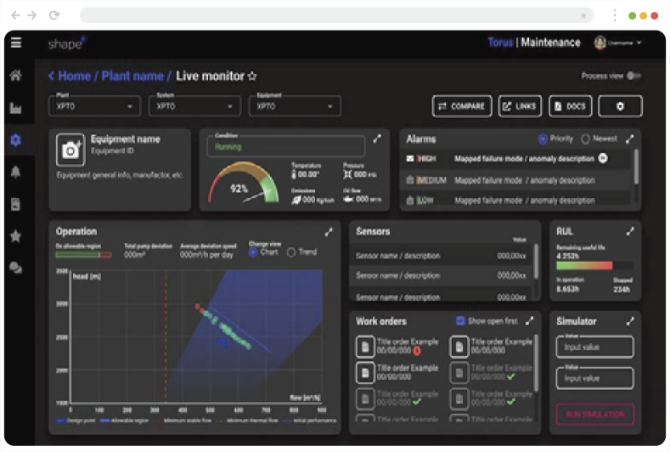
ASSET PANEL
The asset-level dashboard is the one-stop-shop for all information about each asset, including the alarms generated by all predictive and simulation models.
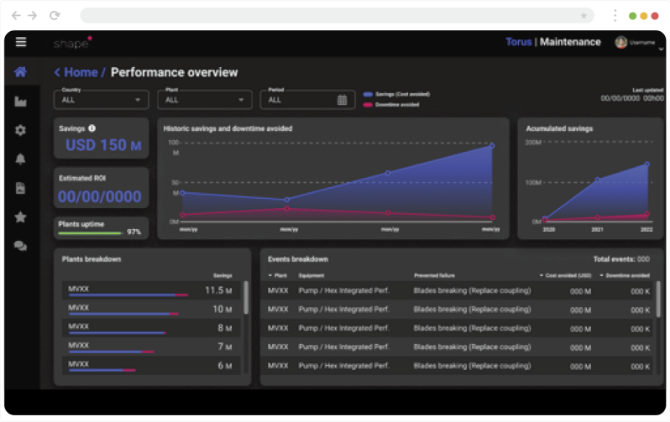
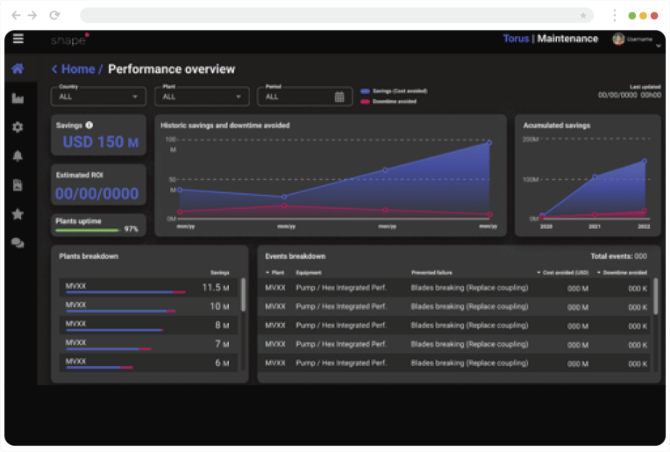
PERFORMANCE
Integrated visualization of the value captured by the solutions in historically avoided downtime. Includes asset performance benchmarking and breakdown of failure events.
SCHEDULE A DEMONSTRATION WITH ONE OF OUR SPECIALISTS